 Data Analytics
 Does Your Data Work for You?
One undeniable result of today’s digital environment is that we now find ourselves immensely and overwhelmingly surrounded…by data. Forward-thinking offices are turning their analysis inwards, using data to track and improve procurement performance. How are you using the data your office collects? Pulse is here with a look at 3 award-winning examples of how data can work for you.
Michigan and the Unrealized Transformative Power of Internally Focused KPIs in Public Procurement
Key performance indicators (KPIs) are a mainstay in the private sector and are gaining traction in public procurement. After a self-evaluation, Michigan’s Central Procurement Services (CPS) developed new strategic goals to improve performance. Aligning KPIs with goals of public procurement may seem simple on the surface: measure cost savings and customer satisfaction. While useful, these are lagging indicators that look at past performance and are not predictive of future performance. CPS paired these with a set of leading indicators to create a more comprehensive view of efficacy for every service area they provide. Some of the KPIs that Michigan CPS uses to measure performance include:
Realized fiscal savings
Net promoter scores (NPS)
Compliance with service level agreement (SLA) timetables (a leading indicator of customer satisfaction)
Employee attrition rate (a leading indicator of both savings and customer satisfaction)
Average supplier performance rating (a leading indicator of customer satisfaction)
Response time for agency customer requests and FOIA inquiries
To ensure that all staff participates in the process, the data used for KPIs is gathered directly from employees’ work within Michigan’s central database. This centralized system allows buyers and their managers to view their personal performance against the KPIs at any time. Large screens in the front of the office show current results and trends. CPS also generates quarterly agency-specific and aggregated reports to document the office’s performance for its agency customers.
The first year of implementation saw immediate improvements for CPS. Requests for Proposals meeting their SLA targets increased from 25% to 62%. NPS increased from 60 to 75. Meetings with agency customers for reviewing complaints and grievances decreased. Satisfaction with, and the overall perception of CPS improved throughout state government. Their KPIs provide opportunities for continuous process improvement by quantifiably identifying areas of weakness and providing evidence and justification for changes to policy, process, or priorities. Consequently, they can allocate time and resources to improving those areas more efficiently.
To learn more, you can read the full project submission or watch this webinar. This project received the Bronze Award at NASPO’s 2018 George Cronin Awards for Procurement Excellence.
Florida’s Market Analysis and Procurement Strategy (MAPS)
Our next example combines market research data gathering with past spend and usage trends to identify present and future needs and inform procurement methods. Florida’s Department of Management Services (DMS) created the Market Analysis and Procurement Strategy (MAPS) process to identify the optimal procurement methods to achieve best value for the state. MAPS is used to determine whether to issue a new competitive solicitation, re-solicit an existing contract, renew an existing contract, or allow an existing contract to expire.
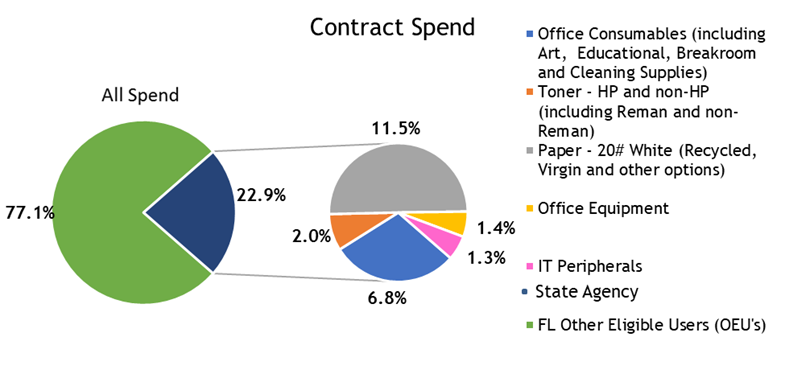
Example of the Office Supplies MAPS comparing spend by product category and by customers.
The data compiled in MAPS portfolios include:
Market research reports from databases including Procurement IQ and GovWin
Prior state contract spend and vendor sales reports from MyFloridaMarketplace
Agency usage and feedback
Pricing analysis comparing similarly sized states, neighboring states, nationwide cooperatives, and GSA schedules
Risk Assessments
When approaching a new procurement, MAPS documentation provides a record of prior decision-making and previous category spend, benchmarks pricing, references existing markets, and illustrates changes in those markets since the prior procurement. This data comparison can show if previous procurement strategies were successful in achieving the best value for the state and subsequently provide a roadmap for improvement and lessons learned. It also serves as documentary evidence for defending procurement decisions against future scrutiny.
Through the MAPS process, the Department ensures that their procurements best meet the needs of our customers by producing high-quality contracts with pricing discounts better than other industry agreements. MAPS improves the method of procurement selection, thus reducing staff time spent in solicitation development, legal review, and routing for approval. During FY2019, state agencies and eligible users realized actual savings of approximately 38.5% over retail or other referenced prices using contracts procured by DMS for various commodities and contractual services.
To learn more, you can read the full project submission, listen to this episode of our Pulse podcast, or watch this webinar. This project received the Silver Award at NASPO’s 2019 George Cronin Awards for Procurement Excellence.
Interagency Data-Driven Collaboration: Wisconsin’s Innovative Approach to Specification Development
Our last example highlights the sharing of information across offices to identify trends and commonalities and leverage them into savings. Less than 1% of all computers purchased by the State of Wisconsin were “standard configurations” under their existing contracts. The prevalence of purchasing custom-configured computers in a piecemeal fashion was leaving significant amounts of previously negotiated savings on the table. Among the potential causes was a disconnect between the standard configurations and actual agency needs. The quick-evolving nature of computer technology often led to standard configurations becoming outdated.
At the time, standard configurations were set on a contract-by-contract basis by individual procurement officials. Often, the lowest-priced configuration was selected as standard, with little flexibility over the life of the contract, and without the buy-in of the agency workgroup. In response, the State Bureau of Procurement (SBP) used spending data to identify agencies with the highest computer spend. IT staff and users from those agencies were paired with the state’s enterprise IT team to create a new standards committee. With the committee’s help, SBP reviewed previous purchasing and agency use data to find the most commonly needed performance specifications and inform the creation of new standard configurations for the most commonly purchased computers. These included options that could be added to the standardized computers for ease of use.
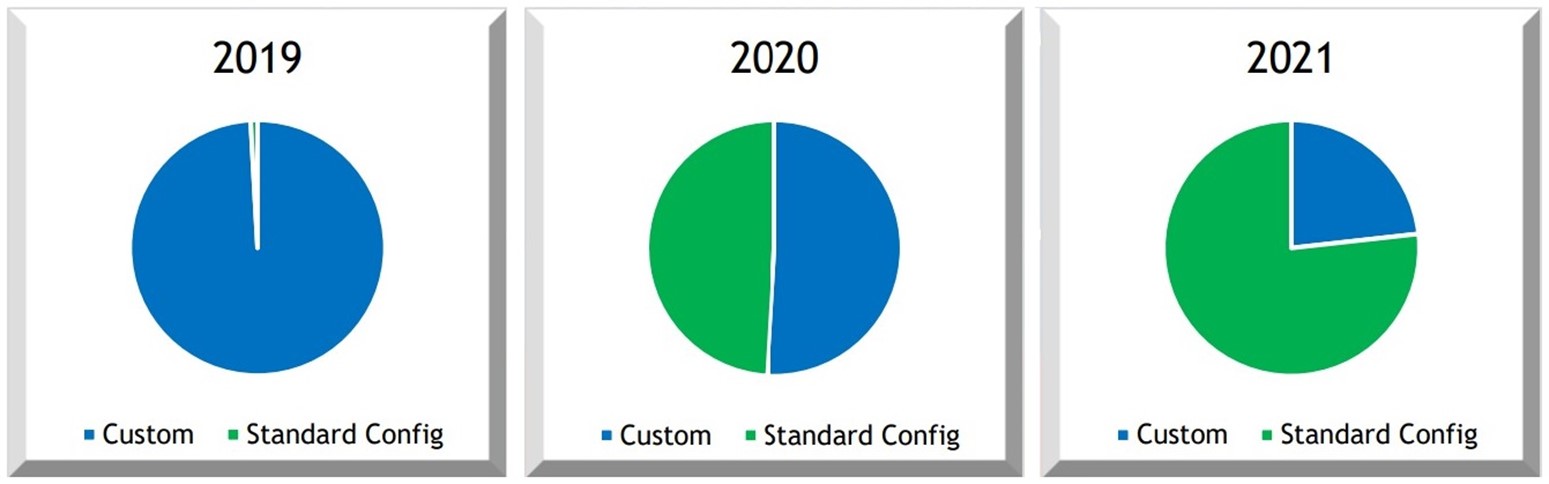
SBP allowed the needs of the users to dictate what features became standardized for the greatest discount opportunities. Contracted vendors were consulted on capabilities and industry trends. The result was 12 different standard configurations, designed to meet the range of needs of all state users. Active contract management allows updates to standard configurations over the life of the contract. The standards committee continues to meet annually to review agency needs and use, contract prices, and market information. By FY2021, more than 73% of computers purchased had standard configurations, which resulted in a cost reduction of nearly $9,000,000.
To learn more, you can read the full project submission (pg. 27) or watch this webinar. This project received the Gold Award at NASPO’s 2021 George Cronin Awards for Procurement Excellence.
You can learn more about data use in public procurement by watching these NASPO webinars on How to Utilize Analysis Tools to Acquire Best Value and Data Analytics Demystified.
If you, or your staff, are interested in growing your data analytics skills, check out these courses in ProcurementU.
For more about the George Cronin Awards for Procurement Excellence, visit the website.